Cartesian Axes
In This Topic
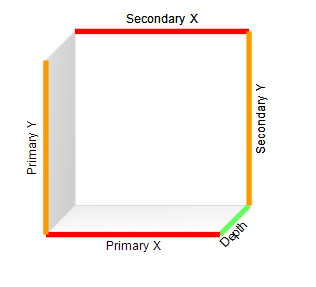
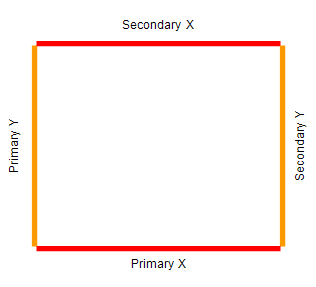
The Axes page of the currently selected charting type is filled with the Cartesian axes, in case the currently selected charting type of the chart area is a Cartesian chart (see Chart Areas for more information). The Cartesian Axes model consists of five axes in 3D and four axes in 2D, as shown on the following images:
|
Cartesian Axes in 3D |
Cartesian Axes in 2D |
|---|---|
 |
 |
| Axis | Topic | Description |
|---|---|---|
| Primary Y | Y Axes | The primary Y axis is the default Y axis on which the chart series produced by the values data grouping are scaled in the chart Y dimension. By default it is located at the left chart side. |
| Secondary Y | Y Axes | The secondary Y axis is optional. To show chart series for a values data grouping on the secondary Y axis, open the values data grouping editor and change the Y Axes property to SecondaryY or Both. By default it is located at the right chart side. |
| Primary X | X Axes | The secondary X axis is optional. To show chart series for a values data grouping on the secondary X axis, open the values data grouping editor and change the X Axes property to SecondaryX or Both. By default it is located at the top chart side. |
| Secondary X | X Axes | The secondary X axis is optional. To show chart series for a values data grouping on the secondary X axis, open the values data grouping editor and change the X Axes property to SecondaryX or Both. By default it is located at the top chart side. |
| Depth | Depth Axis | The depth axis is only displayed in 3D. In all cases however it defines the Z order of the chart series produced by all values data groupings displayed in a Cartesian chart area. |
All Cartesian Axes share a number of common settings related to title, scale, range etc. For a brief description of these settings check out the Common Axis Settings topic.