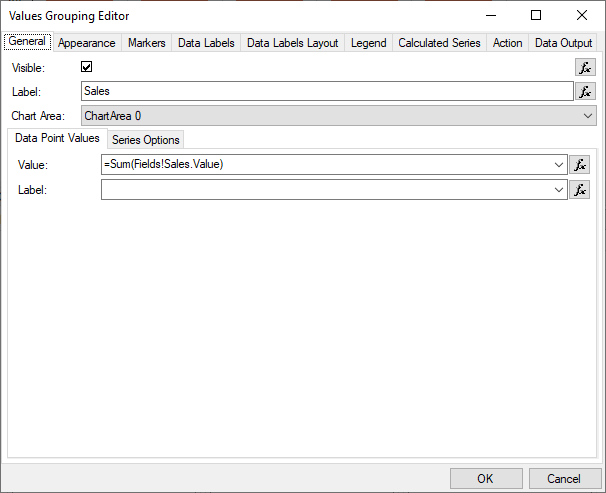
Visible - controls the visibility of the chart series created for the data grouping. You will typically use an expression to conditionally show/hide the values data grouping.
Label - specifies the text, which represents the local series label. The full series label is constructed as a concatenation of the labels of the parent series data groupings (if any), separated by the " - " symbol. For example: if the chart has a series grouping with label "Group 1" and a values data grouping with label "A" the full series label is "Group 1 - A". See the XML Formatted Texts topic for more information on how to create texts with rich formatting.
Separator - Specifies the separator used to delimit names in hierarchically generated value grouping names in legends and category labels.
Tag - Allows you to attach arbitrary information to the chart series generated by the data grouping, which can later be used in custom code.
Chart Area - lets you choose the chart area on which the series produced by the values data grouping are displayed. By default all values data groupings are displayed on the first chart area (Chart Area 0). Because the chart area chart type determines the needed data cell values changing this property may reflect the entries in the Data Group - see below.
Series Type - lets you choose the type of the series created for the data grouping. This setting is only available, when the chart area chart type is set to combo. See Combo Chart for more information.
Data Point Values tab - the entries in the data tab define the {value:expression} pairs that are recorded in the data cell associated with the values data grouping. See The Chart Data Model topic for more information about data cells. You will typically set expressions (not constant values) to the entries in this tab. The count and type of entries in this group depends on the currently selected chart area type and in the case of a combo chart from the series type. They are automatically updated by Nevron Chart for Reporting Services. The documentation for each charting type (series type) specifies the data requirements in details.
Series Options tab - the settings in this type are context sensitive, which means that Nevron Chart for Reporting Services will automatically populate the options tab with relevant settings. Following is a description of the possible options groups:
Inflate Margins - Modifies the ranges of the axes on which the chart scales so that they completely encompass the displayed data. This feature is very useful if you intend to display charts, which are likely to be displayed partially outside of the charting area (bubble chart for example).
Display On Axes - visible only for chart areas with a Cartesian Chart Type.
Y Axes - lets you choose the Y axes on which the series displayed for this values data grouping are scaled in the Y dimension (). By default set to PrimaryY.
X Axes - lets you choose the X axes on which the series displayed for this values data grouping are scaled in the X dimension (only applicable for chart areas, which have a Cartesian chart type). By default set to PrimaryX.
Include in Y Axis Range - whether the series generated by the grouping should be included in the automatic calculation of the Y Axis range. By default set to true.
Include in Y Axis Range - whether the series generated by the grouping should be included in the automatic calculation of the X Axis range. By default set to true.
Series Options - if the chart area in which the values are displayed uses a Combo Chart Type, the following series type specific options are displayed:
Series Type Options Topic Bar Bar Series Area Area Series Smooth Area Smooth Area Series Line Line Series Smooth Line Smooth Line Series Step Line Step Line Series Point Point Series Bubble Bubble Series High Low High Low Series Stock Stock Series Error Bar Error Bar Series Box and Whiskers Box And Whiskers Series Vector Vector Series Range Range Series