This editor contains two pages "Series" and "Data Points". The first one allows you to control the appearance of markers on series level:
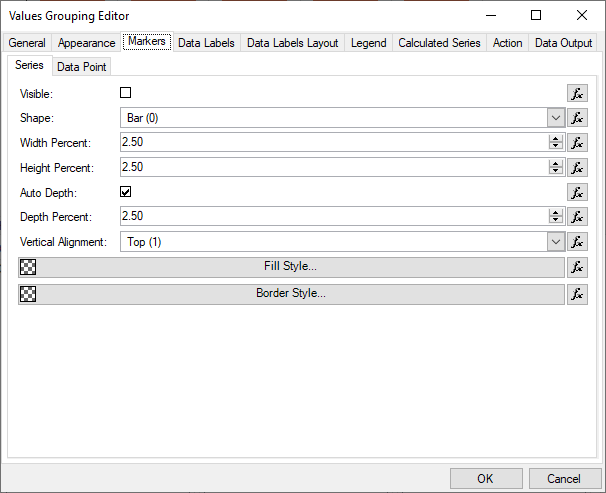
Markers are small shapes displayed at data points. It is important to note that some series do not support markers (for example the surface series does not support markers) and also showing the markers in some charting type is not very typical (for example showing the markers for stock series). Following is a description of the markers settings:
Visible - controls the visibility of the data point markers. By default set to false.
Shape - controls the shape of the data point markers. Possible values are: Bar, Cylinder, Cone, Inverted Cone, Pyramid, Inverted Pyramid, Sphere, Ellipse, Cross, Diagonal Cross, Line Cross, Line Diagonal Cross and Star.
Width Percent - controls the width of the marker shape in percent of the chart width. Generally chosen to be a small value - the default is 2.5%.
Height Percent - controls the height of the marker shape in percent of the chart height. Generally chosen to be a small value - the default is 2.5%.
Auto Depth - specifies whether the depth of the marker should be automatically determined by Nevron Chart for Reporting Services.
Depth Percent - controls the depth of the marker shape in percent of the series depth. Only applicable if Auto Depth is set to false.
Vertical Alignment - controls the vertical alignment of the marker relative to the shape which is used to display the data point. Possible values are Top, Center and Bottom. By default set to Top.
Fill Style - controls the filling of the markers.
Border Style - controls the appearance of the markers border.
If you want to specify marker appearance per data point (most commonly used when you have expressions that you want to specify per data point appearance, size, shape etc.) you need to switch to per data point markers:
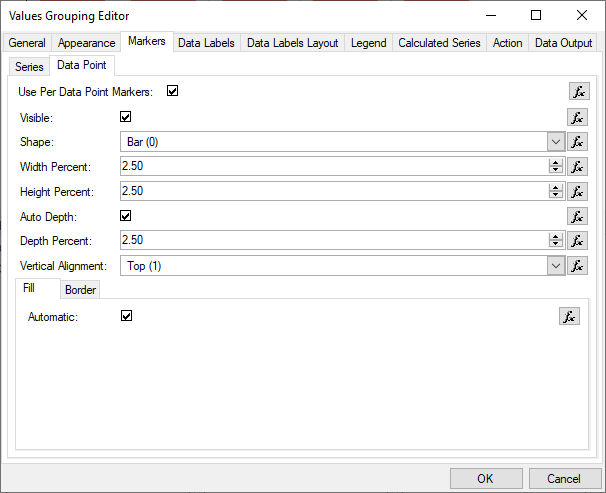
The settings are the same except that you need to check the Use Per Data Point Markers check box in order for those settings to take effect.