Custom Report Items Processing
In This Topic
The Microsoft Reporting Services documentation is sparse for custom report items and the way in which they are processed. On the other hand you as a user need to know the details about this process - this will help you use expressions, groupings, filters and sortings more efficiently. It will also help you understand the context in which certain expressions are evaluated.
Disclaimer: The content of this topic is based on Nevron Software internal research. It is provided "AS IS" and with no warranties for completeness and 100% accuracy.
The topic is for advanced users of MS Reporting Services and although not mandatory, some programming experience will help you understand the pseudo code of the algorithm. We will first start with some terms and definitions and then will describe the processing algorithm in detail.
Terms and Definitions
A custom report item in reporting services has a design model and runtime state. The design model is processed towards a data set to produce a runtime representation of that model for the actual data contained in the data set. It is important to know that for the same design model the runtime state can be different, depending on the data set which is processed.
The following images illustrate a simple custom report item at design time and runtime:
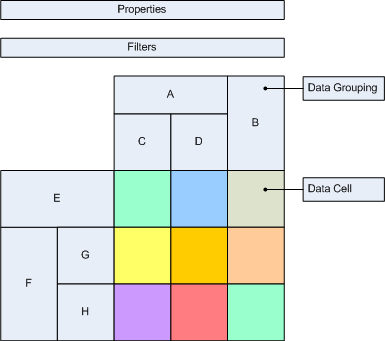
| Figure 1. Design Time |
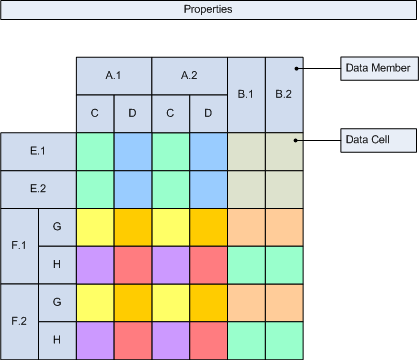
Figure 2. Runtime |
 |
 |
In Figure 1 you can see a sample custom report item at design time. It is assembled from properties, filters, hierarchically organized row and col data groupings and a grid of data cells, which is sized to the count of leaf row/col data groupings.
In Figure 2 you can see a sample custom report item at runtime. It is produced for the design model at Figure 1. Assuming that the A, B, E and F data groupings are dynamic and produced only 2 data members each and also assuming that the C, D, G and H data groupings are static. The color coding helps you see the span of each data cell.
Following is a definition of the terms used in custom report items:
data grouping and data members - a data grouping is either dynamic or static. A dynamic data grouping has groupings, sortings, filters and properties. A static data grouping has only properties. When a dynamic data grouping is processed it creates one or more data members. When a static data grouping is processed it always creates a single data member.
data cell - a data cell is a container for properties. At runtime, the properties of a single design time data cell are evaluated and copied to all the intersections of the row/col data members created for the leaf row/col data groupings, for which the design time data cell was created.
property - at design time a property is a a {name:expression} pair. At runtime a property is {name:value} pair, where the value is taken from the result of the expression evaluation. A custom report item can store properties in three places: in the report item properties, in a data grouping and in a data cell.
data set and fields - a data set is any tabular data source the columns of which are called fields.
recordset - a recordset is an enumeration of a subset of records (rows) from a data set. A recordset is EMPTY, if it contains no records. A recordset is FULL, if it contains all the records from the data set. The intersection of recordsets R1 and R2 is a recordset, which contains records that exist in both R1 and R2.
expression - an expression is a formula string, which is evaluated towards a recordset (e.g. the same expression may evaluate to a different value given a different input recordset). Expressions are used at design time in properties, groupings, sortings and filters.
Processing Algorithm
The processing algorithm is composed by several routines, which are described below. The entry point is the ProcessCustomReportItem routine which is described last.
Intersect
input
RS1 - input recordset 1
RS2 - input recordset 2
output
intersectionRS - recordset, which represents the intersection of the input recordsets
Filter
input
inputRS - input recordset
filters[] - collection of data grouping filters
output
filteredRS - subset of the input recordset the records of which match the filters
description
In order for a record from the inputRS to be included in the filteredRS all filters must evaluate to true. A filter is a predicate, which contains a condition expression, operator and value(s). The condition expression result is compared with an operator towards the values, which may also be expressions. Both the condition and values expressions are evaluated towards the currently filtered record (e.g. towards a single record recordset).
Group
input
inputRS - input recordset
groupByExpressions - collection of data grouping group by expressions.
output
groupRecordsets[] - collection of recordsets, which are the groups inside inputRS produced by the grouping
description
The groupingExpressions are evaluated towards each record of the inputRS. A group recordset is created for each subset of the inputRS for which all grouping expressions evaluated to the same value.
Sort
input
recordsets[] - collection of input recordsets to sort
sortings[] - collection of data grouping sortings
output
sortedRecordsets[] - sorted collection of the input recordsets
description
Each sorting is a pair of expression and direction (ascending or descending). For each pair of input recordsets R1 and R2 the sortings define their order (R1 < R2, R1 = R2 or R1 > R2) by evaluating the sorting expression towards R1 and R2 and comparing the resulting values. If the values are equal the operation is performed for the next sorting. The input recordsets are sorted given this order.
Evaluate
input
properties - a collection of {name:expression} pairs
recordset - recordset towards which to evaluate
output
properties - a collection of {name:value} pairs
description
Evaluates all properties towards the specified recordset and returns the evaluated properties.
UpdateDataCellSpan
input
dataGrouping - leaf data grouping
dataMember - leaf data member
recordset - leaf row/col recordset
description
Updates the data cell span information. This routine is called for each processed leaf row or col data grouping. The method builds up the information needed to resize the runtime data cells grid, stores information about the rows/cols span of a data cell and stores the leaf row and col recordsets. This information is used by the final step of the ProcessCustomReportItem routine.
ProcessDataGrouping
input
dataGrouping - data grouping which to process and convert to data members
recordset - input recordsets towards which to process the data grouping
output
dataMembers - resulting data members
description
Processes a data grouping towards the recordset and returns a collection of data members. The pseudo code of this routine is:
// for a static data grouping -> create only one data member
if (dataGrouping.IsStatic)
{
dataMember = new DataMember
dataMembers.Add(dataMember)
// evaluate the properties of the data member
dataMember.Properties = Evaluate(dataGrouping.Properties, groupRecordset)
if (dataGrouping.IsLeaf)
{
// in case the data grouping is a leaf, update its row/col span and the intersection recordsets
UpdateDataCellSpan(dataGrouping, dataMember, groupRecordset);
}
else
{
// in case the data grouping has children, recursively process them and add them to the data member
foreach (childDataGrouping in dataGrouping.ChildDataGroupings)
{
dataMember.ChildDataMembers = ProcessDataGrouping(childDataGrouping, groupRecordset)
}
}
return dataMembers
}
// for a dynamic data grouping - first filter the input recordset with the data grouping filters
recordset = Filter(recordset, dataGrouping.Filters)
// create the group recordsets using the data grouping group by expressions
groupRecordsets = Group(recordset, dataGrouping.GroupByExpressions)
// sort the group recordsets with the data grouping sortings
groupRecordsets = Sort(groupRecordsets, dataGrouping.Sortings)
// create a data member for each group recordsets
foreach groupRecordset in groupRecordsets
{
dataMember = new DataMember
dataMembers.Add(dataMember)
// evaluate the properties of the data member
dataMember.Properties = Evaluate(dataGrouping.Properties, groupRecordset)
if (dataGrouping.IsLeaf)
{
// in case the data grouping is a leaf, update its row/col span and the intersection recordsets
UpdateDataCellSpan(dataGrouping, dataMember, groupRecordset);
}
else
{
// in case the data grouping has children, recursively process them and add them to the data member
foreach (childDataGrouping in dataGrouping.ChildDataGroupings)
{
dataMember.ChildDataMembers = ProcessDataGrouping(childDataGrouping, groupRecordset)
}
}
}
return dataMembers
ProcessCustomReportItem
input
designCRI - a custom report item design time structure
output
runtimeCRI - a custom report item runtime structure
description
The custom report item processing is best illustrated in pseudo code:
// initially start with a full recordset
cur = FULL
// evaluate the report item properties
runtimeCRI.Properties = Evaluate(designCRI.Properties, cur)
// filter the recordset with the report item filters
cur = Filter(cur, designCRI.Filters)
// process the col data groupings
foreach dataGrouping in designCRI.ColumnDataGroupings
{
runtimeCRI.AddColumnDataMembers(ProcessDataGrouping(dataGrouping, cur))
}
// process the row data groupings
foreach dataGrouping in designCRI.RowDataGroupings
{
runtimeCRI.AddRowDataMembers(ProcessDataGrouping(dataGrouping, cur))
}
// perform the cross intersection of the data cells the information needed is
// 1. leaf row and col recordset
// 2. design data cell whose properties to evaluate
// this information is accumulated by the UpdateDataCellSpan routine
foreach row in runtimeCRI.Rows
{
foreach col in runtimeCRI.Cols
{
// get the data cell whose properties to evaluate
dataCell = DataCellSpan.GetDataCell(row, col)
// get the row and col recordsets
rowRS = DataCellSpan.GetRowRecordset(row)
colRS = DataCellSpan.GetColRecordset(col)
// intersect the recordsets
cur = Intersect(rowRS, colRS)
// evaluate the data cell towards the intersection recordset
runtimeCRI[row, col] = Evaluate(dataCell, cur)
}
}
Questions and Answers
Now that you know how custom report items are processed it is time to answer some common questions:
Q. Where does Nevron Chart for Reporting Services stores its properties
A. All settings that you see in the Chart Properties > Chart tab are stored in the custom report item properties. All settings that you see in the Values Grouping Editor are stored in the static data grouping representing the values, except the expressions in the Data tab, which are stored in the associated data cell. The category and series data grouping editors store the Label property in the respective dynamic data grouping.
Q. What expressions to use in Report Item Properties (e.g. for properties in the Chart tab)
A. Because the report item properties are evaluated towards a FULL recordset it only makes sense to use aggregates like SUM, MIN, MAX etc. and avoid FIRST. For these properties we generally recommend to avoid field expressions, but rather use expressions, which reference report parameters, globals etc.
Q. What expression to use for the Label of a Category/Series Data Grouping
A. We recommend to use the field on which you group.
Q. What expression to use for the Data Point Values (in the Values Group Editor - Data tab)
A. We recommend to use a field value, since this will be recorded in a data cell.
Q. How to Group and Sort
A. We recommend to group by a single field value and use that single field value in the sorting expression (if necessary). In general you can only sort on what you group (because the grouped recordsets, not records get sorted) - for example: if you group by field A - you can only sort by field A. If you group by fields A and B then you can only sort on A, B or A and B.