Horizontal Charts
In This Topic
Very often it is necessary to display some charting types like Bar, Float Bar, Line etc. in a horizontal projection. This topic will provide you with a step by step tutorial how to do that in 2D and 3D.
2D Horizontal Charts
First you need to decide whether your chart needs to be oriented from left-to-right or right-to-left. The following image illustrate the most common left-to-right and right-to-left 2D charts:
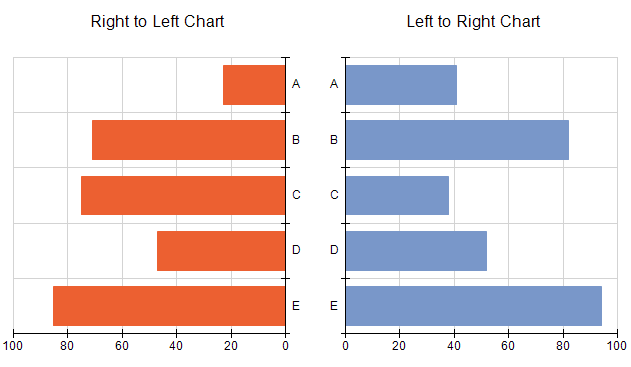
- Left To Right Chart
1. Switch to 2D Mode
From the Chart Areas > 2D/3D Effects - set Mode to TwoD
2. Change the Orientation
From the Chart Areas > 2D/3D Effects - set Orientation to Left To Right
3. Change the Primary Y Axis Position to Right
From Chart Areas > Axes > Primary Y - set Position to Right
4. Invert the Primary X Axis as needed
If you want categories to grow from top to bottom, from Chart Areas > Axes > Primary X > Scale - set Inverted to false.
If you want categories to grow from bottom to top, from Chart Areas > Axes > Primary X > Scale - set Inverted to true.
- Right To Left Chart
1. Switch to 2D Mode
From the Chart Areas > 2D/3D Effects - set Mode to TwoD
2. Change the Orientation
From the Chart Areas > 2D/3D Effects - set Orientation to Right To Left
3. Change the Y Axis Position to Left
From Chart Areas > Axes > Primary Y - set Position to Left
4. Invert the Primary X Axis as needed
If you want categories to grow from top to bottom, from Chart Areas > Axes > Primary X > Scale - set Inverted to true.
If you want categories to grow from bottom to top, from Chart Areas > Axes > Primary X > Scale - set Inverted to false.
3D Horizontal Charts
In 3D the chart orientation is achieved similarly. The following image illustrate the most common left-to-right or right-to-left 3D charts:
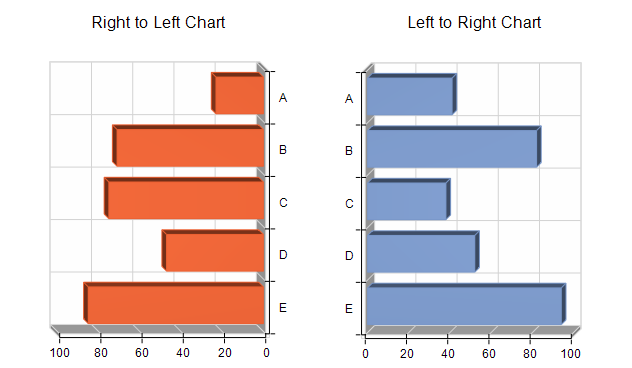
- Left To Right Chart
1. Switch to 3D Mode
From the Chart Areas > 2D/3D Effects - set Mode to ThreeD
2. Change the Projection
From the Chart Areas > 2D/3D Effects
- set Viewer Rotation to -90.
- set Projection Type to Orthogonal
- set X Depth Offset to 0.25
3. Change the Primary Y Axis Position to Right
From Chart Areas > Axes > Primary Y - set Position to Right
4. Invert the Primary X Axis as needed
If you want categories to grow from top to bottom, from Chart Areas > Axes > Primary X > Scale - set Inverted to false.
If you want categories to grow from bottom to top, from Chart Areas > Axes > Primary X > Scale - set Inverted to true.
- Right To Left Chart
1. Switch to 3D Mode
From the Chart Areas > 2D/3D Effects - set Mode to ThreeD
2. Change the Projection
From the Chart Areas > 2D/3D Effects
- set Viewer Rotation to 90.
- set Projection Type to Orthogonal
- set X Depth Offset to -0.25
3. Change the Y Axis Position to Left
From Chart Areas > Axes > Primary Y - set Position to Left
4. Invert the Primary X Axis as needed
If you want categories to grow from top to bottom, from Chart Areas > Axes > Primary X > Scale - set Inverted to true.
If you want categories to grow from bottom to top, from Chart Areas > Axes > Primary X > Scale - set Inverted to false.
Advantages
Other charts for Reporting Services, will provide a different charting type (series type) for horizontal bars, lines etc., but this limits the number of possible combinations that you can use in horizontal charts. It also limits the orientation variants (e.g. very often there is no right to left chart). In Nevron Chart for Reporting Services you can turn each type of chart to a horizontal one by following the above mentioned easy steps.