Nevron Chart for Reporting Services supports multiple chart areas, legends and titles. In order to take full advantage of this feature you must understand how the chart layout system works.
Nevron Chart for Reporting Services treats chart areas, legends and titles as panels. Panels use a box model, which is summarized by the following drawing:
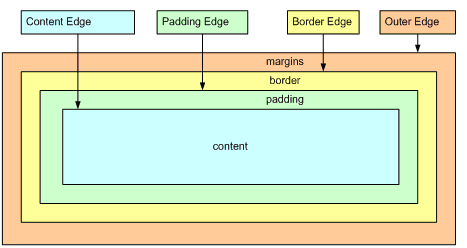
Each panel has margins and padding. The margins define a white space around each panel. The padding defines the space with which the panel content is padded (inflated). The margins and padding settings can be inherited from the chart default margins and padding settings, if the respective Automatic property is set to true.
By default the Automatic property for the margins and padding of all panels is set to true and the actual margins and padding are obtained from the chart control default margins and padding. You can modify the default margins and padding from the Chart - Layout tab. The margins and padding of each panel are accessible from the Layout tab for that panel.
In general the layout algorithm described below uses a combination of docking and absolute positioning. When a panel is docked both it margins and padding are taken into account to display the content at its best size. When a panel is manually positioned the margins are ignored, since they are not needed (margins define a white space, which only automatic layouts should consider).
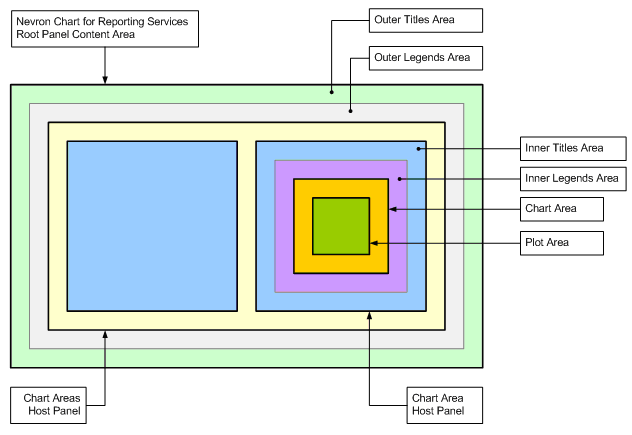
The following image illustrates the layout areas in the Nevron Chart for Reporting Services product:
The layout algorithm performs the following steps:
-
Layout the Outer Titles
Outer titles are such titles for which the Position property is set to Dock To Chart.
The Dock Position property in this case determines the side at which the title must be docked in the outer titles area and the alignment of the title in this side area. For example:
Dock Position = Top Center means dock the title to the top side and align it in the center.
Dock Position = Right Top means dock the title to the right side and align it to the top.
-
Layout the Outer Legends
Outer legends are such legends for which the Position property is set to Dock To Chart. Outer legends are arranged in the same way as the outer titles.
-
Position the Chart Areas Host Panel
The chart areas host panel is an invisible panel, which fills the space which remains after steps 1 and 2 have been performed.
-
Layout the Chart Area Host Panels
The chart areas host panels are invisible panels, which are created for each chart area. These panels are split into two sets - the ones that use automatic positioning and the ones that use manual positioning.
A chart area uses automatic positioning, if its Automatic position property is set to true (go to Chart Area - Layout tab and set to true the Automatic property in the Position group). Automatically positioned chart areas are placed in the cells of an imaginary grid, the sizing of which is determined by the Chart - Layout - Chart Areas Layout property group.
A chart area uses manual positioning, if its Automatic position property is set to false. In this case you specify the left, right, top and bottom sides of the chart area in percents of the Chart Areas Host Panel (go to Chart Area - Layout tab and set to false the Automatic property in the Position group. Then modify the Left Percent, Right Percent, Top Percent and Bottom Percent properties).
The Z order of the chart areas is always determined by the order in which they appear in the Chart Areas Collection.
-
Layout the Inner Titles (for each chart area host panel)
Inner titles are such titles for which the Position property is set to Dock To Chart Area. You must pick a chart area to which to dock from the Chart Area property. The Dock Position property in this case determines the side at which the title must be docked in the inner titles area of the chart area host panel and the alignment of the title in this side area.
-
Layout the Inner Legends (for each chart area host panel)
Inner legends are such legends for which the Position property is set to Dock To Chart Area. Inner legends are arranged in the same way as inner titles.
-
Position the chart areas (for each chart area host panel)
The chart area fills the space, which remains after steps 5 and 6 have been performed.
-
Layout the Plot Titles (for each chart area)
Plot titles are such titles for which the Position property is set to Dock To Chart Plot Area. You must pick a chart area to which to dock from the Chart Area property. The Dock Position property in this case determines the side at which the title must be docked in the chart plot area and the alignment of the title in this side area.
-
Layout the Plot Legends (for each chart area)
Plot legends are such titles for which the Position property is set to Dock To Chart Plot Area. Plot legends are arranged in the same way as plot titles.
-
Layout the Floating Legends
Floating legends are such legends for which the Position property is set to Manual. A floating legend is positioned relatively to a pin point. The pin point coordinates are specified in percents of the area, which remained after the control border was applied (by the Pin X Percent and Pin Y Percent properties). The legend is aligned to the pin point via the Pin Alignment property. For example:
Pin X Percent = 0, Pin Y Percent = 0, Pin Alignment = Bottom Right - means position the pin point at the 0, 0 percents and align the legend so that it is located at the bottom right side of the pin point.
-
Layout the Floating Titles
Floating titles are such titles for which the Position property is set to Manual. A floating title is positioned in the same way as a floating legend.