The Gauge Visual Interface
In This Topic
At report design time, Nevron Gauge for Reporting Services appears as a report item in the Report Items section of the Toolbox. It is represented by this icon:

Adorner Panels and Drag and Drop
When you drag and drop the gauge in the report design surface, it will initially display a default radial gauge with one adorner panel - for the gauge categories:
You will typically drop dimension fields in the categories adorner panel. Each field that you drop in the categories panel will create a category data grouping. Each category data grouping is represented by a card in the category data grouping adorner panel.
It is not required to drop any category fields.
Gauge report items are performing data analysis on data sets. In gauges the category data groupings define the way in which the data is sampled prior to being analyzed by a gauge formula. See the The Gauge Data Model for a complete discussion.
Once you have finished defining the categories you need to open the gauge report item properties dialog to further tune the gauge.
Gauge Report Item Properties
If no category data grouping card is selected in the categories adorner panel, you can show the gauge report item properties dialog by right clicking on the report item and choosing the Properties command.
The Gauge Properties Dialog is constructed by hierarchically organized tabs and has a preview of the gauge located on top. Changes to the actual gauge report item are not applied until you press the Apply or OK buttons located at the right bottom side of the dialog.
The Gauge Properties Dialog consists of the following major tabs:
- Gauge tab - lets you edit the gauge areas, titles and all properties associated with them. The following image illustrates the Gauge tab:
- Data tab - lets you select a data set, edit the category data groupings and the report item filters. The Data tab is illustrated by the following image:
- Code tab - lets you type custom code that is executed at runtime. For more information check out the Code Embedding topic.
- Rendering Tab - lets you tune the rendering output of gauge report item. For more information take a look at the Rendering Options topic.
Category Data Grouping Properties
The category data groupings editor can be shown in two ways:
- From the Categories Adorner Panel - double click on a category data grouping card. Or click to select the card, right click to show the context menu and choose the Properties command.
- From the Gauge > Data tab - double click on a category data grouping item. Or click to select the item and then press the edit button.
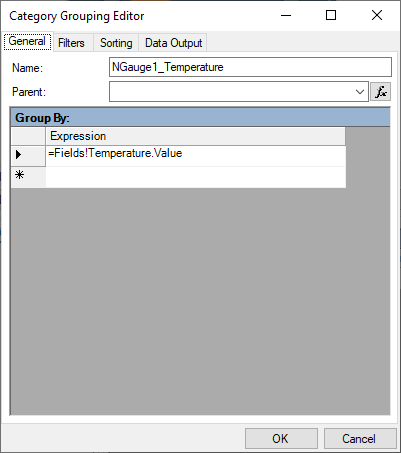
The category data groupings editor is illustrated by the following image:
See Also