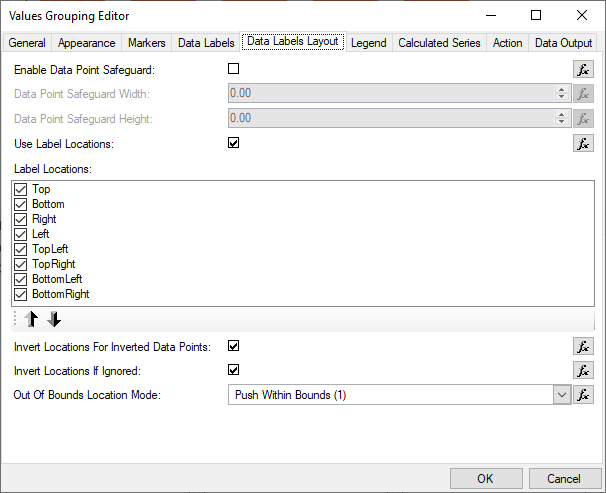
The settings in this tab page allow you to fine tune the automatic data labels displayed by the chart.
Enable Data Point Safeguard - when checked the automatic label layout will protect data point from being overlapped by the labels. You can also add additional space around the data point using the Data Point Safeguard Width and Data Point Safeguard Height controls.
Use Label Locations - when initial positioning is enabled at chart level (see Chart Areas) you can additionally instruct the data series to use an initial label location from a set of proposed locations situated around the origin point of the label. The control selects the location that causes minimum potential conflicts with other labels locations.
Up to eight location proposals can be specified separately for each data series. For example in a chart with two series – line and bar, you can allow the line data labels to go in all eight directions (top, bottom, left, right, top-left, top-right, bottom-left, bottom-right) and at the same time the bar labels can be restricted to just “top” and “bottom” so that they appear either above or below the label origin point.
The order of the location proposals in the Label Locations list box determines their priority (only checked locations are considered). The first proposed location has highest priority, which means that it will be selected unless it causes more conflicts than any of the following proposed locations. You can change the location priority with the Up / Down arrow buttons at the bottom of the list box.
Out Of Bounds Location Mode - in some cases the proposed label locations fall outside the plot area. In such cases Out Of Bounds Location Mode combo allows you to specify how such “out-of-bounds” proposed locations should be treated. Possible values are:
Ignore Location - locations that fall outside the plot area are ignored.
Push Within Bounds - locations that fall outside the plot area are shifted so that they fit inside the plot area.
Use Location - the location is always used.
Invert Locations For Inverted Data Points - when checked the control will invert the proposed locations for charting types that display oriented data points like for example bar and area charts.
Invert Locations If Ignored - if all of the proposed locations are ignored the control can invert the locations automatically so that there is another chance for the label to be displayed.