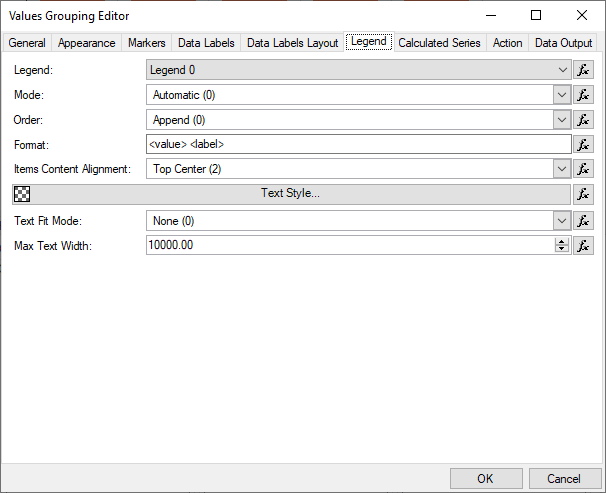
The series generated for a particular values data grouping can be annotated on exactly one of the chart legends. Following is a description of the properties, which control this annotation process:
Legend - lets you choose the legend on which the series generated for the values data grouping are annotated.
Mode - defines the annotation mode of the series. Possible values are:
Automatic - the annotation mode is automatically determined by the chart area chart type. The documentation of each chart type specifies the meaning of this setting in the context of the chart type.
None - the series is not annotated in any way.
Label - the series full label is displayed in the legend.
Data Points - the series data points are displayed in the legend. The text used to represent each data point is determined by the Format property.
Logic - series specific information is displayed in the legend.
Order - defines the order in which legend data items (content) generated by the series are inserted into the legend. Possible values are:
Append - content is appended to previous legend content.
Prepend - content is pretended to previous legend content.
Append Inverted - content is first inverted and appended to previous legend content.
Prepend Inverted - content is first inverted and then pretended to previous legend content.
Format - specifies the format of the data labels texts. Applicable only for Data Points mode. See the Data Point Formatting Commands topic for a complete discussion on the commands, which can be used.
Text Style - specifies the text style which is used for the legend items generated by the series.